
200 300 Users Ultimate Risk Matrix
This annual Ultimate Risk Matrix license is tailored for teams with 200 300 users, giving you a cleaner fit between reporting needs, user access, and rollout cost.
Use this tier to map likelihood versus impact in Power BI while matching the license to teams with 200 300 users.
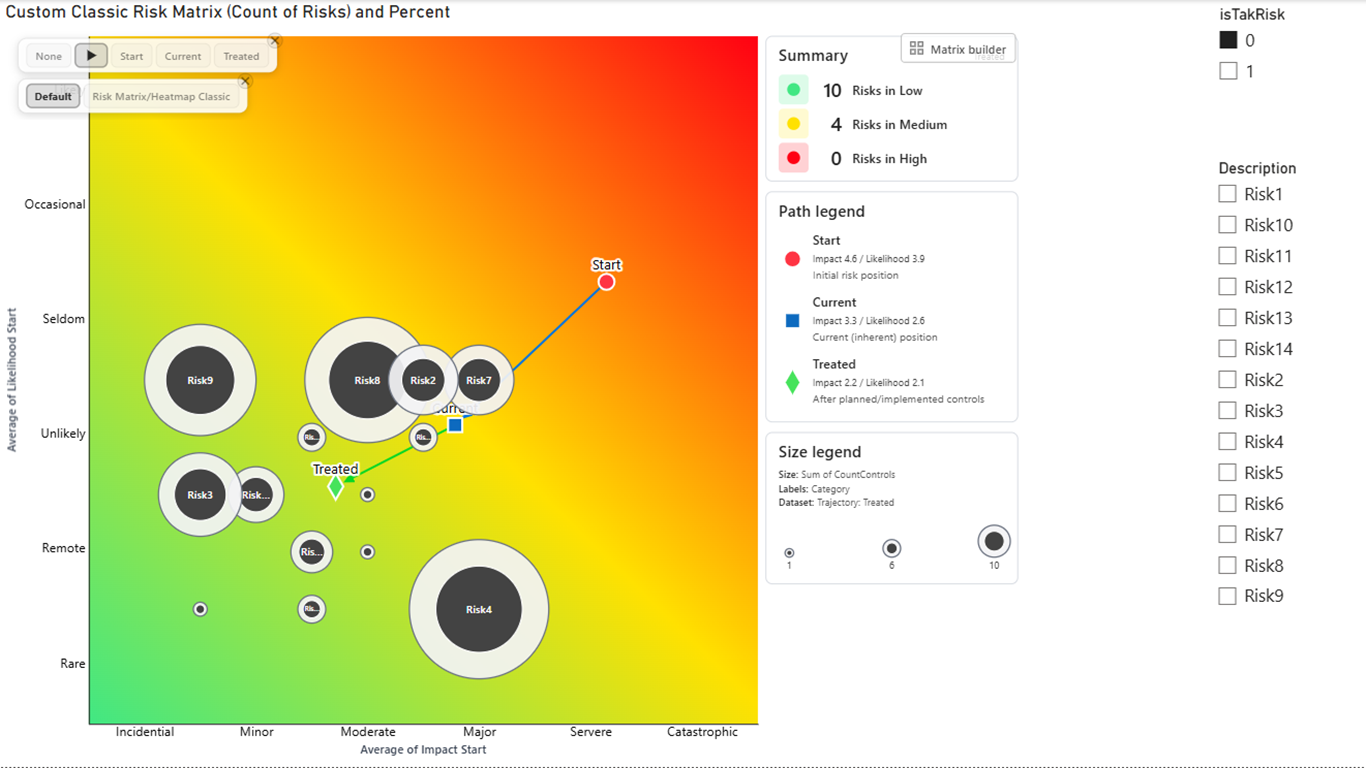
Ultimate Risk Matrix helps teams with 200 300 users identify and assess risks in Power BI by plotting likelihood versus impact. Price for one year. Many teams also refer to a risk matrix as a risk heatmap, especially when they need a compact visual to discuss exposure in steering committees and executive reviews.
Who this license is for
This Ultimate Risk Matrix 2.0 license is aimed at business, audit, and compliance teams with 200 300 users that need a sharper way to communicate risk in Power BI.
- Build square or rectangular matrices such as 6×5 with the Full Custom Matrix Builder.
- Configure up to 10 bands and assign point shapes by risk band or dataset.
- Explain risk movement with modern tooltips, configurable legends, and animated trajectories.
- Use Core + Ring category points or modern aggregated risk bubbles.
- Match the annual license to teams operating at the 200 300 users scale.
659.00 EUR
Frequently Asked Questions
Find answers to common questions about our services.
Power BI Ready Visualizations are custom visuals designed for seamless integration with Microsoft Power BI.
You can install them directly from the Power BI marketplace or upload them manually.
Yes, our visuals are compatible with the latest versions of Power BI.
Absolutely! You can modify them to fit your specific data needs.
We provide comprehensive support and documentation for all our visuals.